Logs with Filebeat, Logstash, Elasticsearch and Kibana
Complex systems require monitoring. An important part of this are the log files. The best way to access, search and view multiple log files is the combination of Filebeat, Logstash, Elasticsearch and Kibana.
However, configuring them can be difficult. Here I am demonstrating a possible setup.
First, some words about each of them, in case you don't know them:
Filebeat is a tool, that watches for file system changes and uploads the file contents to a destination (output). Elasticsearch and Logstash are the most commonly used, Kafka and many others are also supported.
Logstash is a tool for beautifying the logs. It is based on the input-filter-output model. It can convert the log files into a different format, it can add and remove fields, etc.
Elasticsearch is a very famous search engine, based on Lucene. Stores documents inside indices.
Kibana is basically the GUI of Elasticsearch. It provides a user interface for searching and displaying data from indices and managing them.
What to log
In this setup I am demonstrating how to handle the system logs (syslog and auth log). The same can be done for other logs, like nginx, mysql, apache2, etc. and application logs.
Elastic search configuration
The "index rollover" topic was covered in a previous post. I will skip the detailed explanation here.
We will upload the logs to the index alias /system
Create the lifecycle police
The lifecycle below will rollover the index after 1 day or when it gets bigger than 500MB. Additionally it will delete it completely one day after the rollover. This way we keep only the last 2 indices.
PUT _ilm/policy/logs-lifecycle
{
  "policy": {
    "phases": {
      "hot": {
        "min_age": "0ms",
        "actions": {
          "rollover": {
            "max_size": "500mb",
            "max_age": "1d"
          },
          "set_priority": {
            "priority": 100
          }
        }
      },
      "delete": {
        "min_age": "1d",
        "actions": {
          "delete": {
            "delete_searchable_snapshot": true
          }
        }
      }
    }
  }
}
Create the index template
PUT _index_template/logstash-logs-system
{
  "index_patterns": ["system-*"],
  "template": {
    "settings": {
      "number_of_shards": 1,
      "index": {
        "lifecycle": {
          "name": "logs-lifecycle",
          "rollover_alias": "system"
        }
      }
    }
  }
}
Create the first index and alias
PUT /system-000001
{
  "aliases": {
    "system": {
      "is_write_index" : true
    }
  }
}
Filebeat configuration
Here we configure filebeat to upload the system logs to logstash, when they are changed.
Under /etc/filebeat/modules.d/ you can find multiple module configurations.
Rename "system.yml.disabled" to "system.yml" to enable it. Its contents should look like this:
- module: system
  # Syslog
  syslog:
    enabled: true
  # Authorization logs
  auth:
    enabled: true
In order to upload them to logstash, in /etc/filebeat/filebeat.yml configure the output logstash and comment out others:
output.logstash:
  hosts: ["logstash_host:5044"]
Logstash configuration
Logstash identifies the logs as system logs, adds some fields and uploads them
to the index alias in ElasticSearch.
Note that logstash processes the configurations based on the filenames in alphabetical order. In order to create priority, we can use numbers in the beginning of the filename.
First, the input - under /etc/logstash/conf.d/01-beats-input.conf
input {
  beats {
    port => 5044
  }
}
Second, the filter - under /etc/logstash/conf.d/10-syslog-filter.conf
This will convert the log line to JSON and will add a property "log_type" to it with value "system".
filter {
  if [event][module] == "system" {
    mutate {
      add_field => { "log_type" => "system" }
    }
    if [fileset][name] == "auth" {
      grok {
        match => { "message" => ["%{SYSLOGTIMESTAMP:[system][auth][timestamp]} %{SYSLOGHOST:[system][auth][hostname]} sshd(?:\[%{POSINT:[system][auth][pid]}\])?: %{DATA:[system][auth][ssh][event]} %{DATA:[system][auth][ssh][method]} for (invalid user )?%{DATA:[system][auth][user]} from %{IPORHOST:[system][auth][ssh][ip]} port %{NUMBER:[system][auth][ssh][port]} ssh2(: %{GREEDYDATA:[system][auth][ssh][signature]})?",
                  "%{SYSLOGTIMESTAMP:[system][auth][timestamp]} %{SYSLOGHOST:[system][auth][hostname]} sshd(?:\[%{POSINT:[system][auth][pid]}\])?: %{DATA:[system][auth][ssh][event]} user %{DATA:[system][auth][user]} from %{IPORHOST:[system][auth][ssh][ip]}",
                  "%{SYSLOGTIMESTAMP:[system][auth][timestamp]} %{SYSLOGHOST:[system][auth][hostname]} sshd(?:\[%{POSINT:[system][auth][pid]}\])?: Did not receive identification string from %{IPORHOST:[system][auth][ssh][dropped_ip]}",
                  "%{SYSLOGTIMESTAMP:[system][auth][timestamp]} %{SYSLOGHOST:[system][auth][hostname]} sudo(?:\[%{POSINT:[system][auth][pid]}\])?: \s*%{DATA:[system][auth][user]} :( %{DATA:[system][auth][sudo][error]} ;)? TTY=%{DATA:[system][auth][sudo][tty]} ; PWD=%{DATA:[system][auth][sudo][pwd]} ; USER=%{DATA:[system][auth][sudo][user]} ; COMMAND=%{GREEDYDATA:[system][auth][sudo][command]}",
                  "%{SYSLOGTIMESTAMP:[system][auth][timestamp]} %{SYSLOGHOST:[system][auth][hostname]} groupadd(?:\[%{POSINT:[system][auth][pid]}\])?: new group: name=%{DATA:system.auth.groupadd.name}, GID=%{NUMBER:system.auth.groupadd.gid}",
                  "%{SYSLOGTIMESTAMP:[system][auth][timestamp]} %{SYSLOGHOST:[system][auth][hostname]} useradd(?:\[%{POSINT:[system][auth][pid]}\])?: new user: name=%{DATA:[system][auth][useradd][name]}, UID=%{NUMBER:[system][auth][useradd][uid]}, GID=%{NUMBER:[system][auth][useradd][gid]}, home=%{DATA:[system][auth][useradd][home]}, shell=%{DATA:[system][auth][useradd][shell]}$",
                  "%{SYSLOGTIMESTAMP:[system][auth][timestamp]} %{SYSLOGHOST:[system][auth][hostname]} %{DATA:[system][auth][program]}(?:\[%{POSINT:[system][auth][pid]}\])?: %{GREEDYMULTILINE:[system][auth][message]}"] }
        pattern_definitions => {
          "GREEDYMULTILINE"=> "(.|\n)*"
        }
        remove_field => "message"
      }
      date {
        match => [ "[system][auth][timestamp]", "MMM  d HH:mm:ss", "MMM dd HH:mm:ss" ]
      }
      geoip {
        source => "[system][auth][ssh][ip]"
        target => "[system][auth][ssh][geoip]"
      }
    }
    else if [fileset][name] == "syslog" {
      grok {
        match => { "message" => ["%{SYSLOGTIMESTAMP:[system][syslog][timestamp]} %{SYSLOGHOST:[system][syslog][hostname]} %{DATA:[system][syslog][program]}(?:\[%{POSINT:[system][syslog][pid]}\])?: %{GREEDYMULTILINE:[system][syslog][message]}"] }
        pattern_definitions => { "GREEDYMULTILINE" => "(.|\n)*" }
        remove_field => "message"
      }
      date {
        match => [ "[system][syslog][timestamp]", "MMM  d HH:mm:ss", "MMM dd HH:mm:ss" ]
      }
    }
  }
}
Finally, the output - under /etc/logstash/conf.d/20-elasticsearch-output.conf
The following will send the json log line to elasticsearch. The index/alias name is the value of the field "log_type", e.g. /system.
output {
  elasticsearch {
    hosts => ["elastic_host:9200"]
    sniffing => true
    manage_template => false
    index => "%{[log_type]}"
  }
}
Kibana
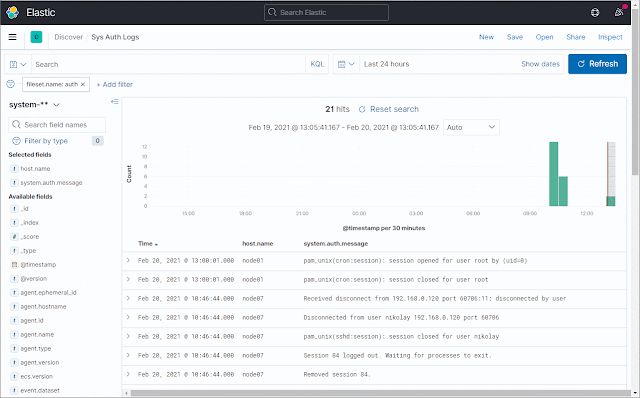
Index pattern: system-**
When viewing the index, you can filter by "fileset.name" (e.g. "auth" for the auth logs).
I also recommend adding the following columns to the view: host.name, system.auth.message
Finally, you can save the search to access it easier later.
It should look like this:
