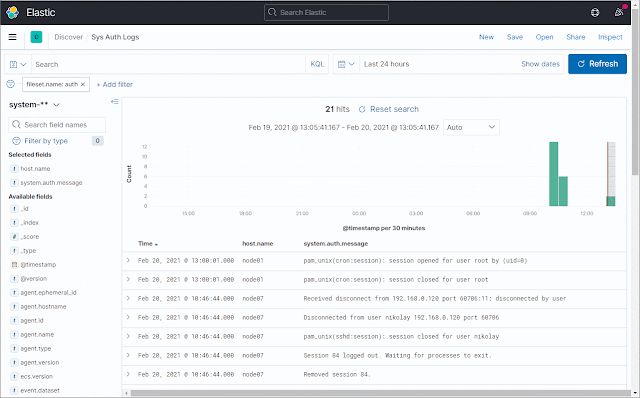
Logs with Filebeat, Logstash, Elasticsearch and Kibana

Complex systems require monitoring. An important part of this are the log files. The best way to access, search and view multiple log files is the combination of Filebeat, Logstash, Elasticsearch and Kibana. However, configuring them can be difficult. Here I am demonstrating a possible setup. First, some words about each of them, in case you don't know them: Filebeat is a tool, that watches for file system changes and uploads the file contents to a destination (output). Elasticsearch and Logstash are the most commonly used, Kafka and many others are also supported. Logstash is a tool for beautifying the logs. It is based on the input-filter-output model. It can convert the log files into a different format, it can add and remove fields, etc. Elasticsearch is a very famous search engine, based on Lucene. Stores documents inside indices. Kibana is basically the GUI of Elasticsearch. It provides a user interface for searching and displaying data...